Archived article
Please note that tax, investment, pension and ISA rules can change and the information and any views contained in this article may now be inaccurate.
“Nerves surrounding exactly what would be in Prime Minister Theresa May’s unscheduled statement today explain why the FTSE 100 fell so sharply at the opening but stocks may not remain too rattled for too long – assuming that the opinion polls and history both prove a reliable guide this time around," says AJ Bell Investment Director Russ Mould.
“Analysis of General Election results since the inception of the FTSE All-Share in 1962 shows that the index has tended to do better, on average, under Conservative Prime Ministers.
Prime Minister & term |
Party |
Change in FTSE All-Share |
Margaret Thatcher, 1979-90 |
Conservative |
270.6% |
John Major, 1990-1997 |
Conservative |
107.1% |
James Callaghan, 1976-79 |
Labour |
66.7% |
David Cameron, 2010-16 |
Conservative |
36.9% |
Edward Heath, 1970-74 |
Conservative |
21.9% |
Tony Blair, 1997-2007 |
Labour |
19.9% |
Theresa May, 2016- |
Conservative |
10.0% |
Harold Wilson, 1964-70 |
Labour |
9.0% |
Harold Wilson, 1974-76 |
Labour |
8.6% |
Gordon Brown, 2007-10 |
Labour |
-19.2% |
Source: Thomson Reuters Datastream
“This may offer some comfort to investors who are nervous, especially as Mrs May has a big lead in the polls.
“In addition, the historic data also show how the mid-term elections of 1966 and 1974 failed to derail stocks.
“In this case the UK stock market seemed unconcerned by either the party affiliation of the person in charge or the size of their majority – so while Mrs May will want to add to her party’s haul of seats in Westminster this may be less of a concern for investors, relative to the overall result.
|
Majority |
Full term |
Conservative 1983-87 (Thatcher) |
144 |
152.8% |
Labour 1974-79 (Wilson / Callaghan)** |
3 |
84.4% |
Conservative 1992-97 (Major) |
21 |
83.5% |
Conservative 1979-83 (Thatcher) |
43 |
57.8% |
Conservative/Lib Dem 2010-15 (Cameron) |
36 |
41.9% |
Labour 1997-2001 (Blair) |
179 |
33.7% |
Conservative 1970-74 (Heath) |
31 |
21.9% |
Labour 1964-70 (Wilson)* |
96 |
20.1% |
Labour 2005-10 (Blair/Brown) |
66 |
11.3% |
Conservative 1987-92 (Thatcher / Major) |
102 |
2.3% |
Labour 2001-05 (Blair) |
167 |
-15.6% |
Source: Thomson Reuters Datastream
* Initially won majority of 4 in 1964. Increased to 96 in 1966.
** Initially a minority of 33 in February 1974. Won majority of 3 in October 1974.
“History also suggests that the market prefers a win for the incumbent PM, again irrespective of their political leanings, perhaps as this means they are dealing with a known quantity, although the performance differential over a full term is in this case relatively minor.
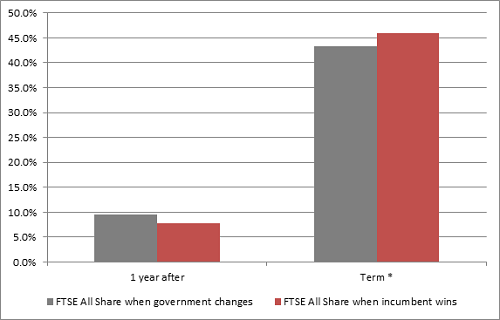
Source: Thomson Reuters Datastream, AJ Bell Research. All General Elections since 1962. 1964/66 to 1970 and 1974/74 to 1979 counted as one term.
“However, the opinion polls’ recent sketchy record and the dangers of using historical performance as a guide to the future mean stock market investors are unlikely to take too much on trust and may remain edgy until the result becomes known on 9 June, given that policy on such huge issues as Brexit and Scottish independence, as well as the state of the nation’s finances and economy, are set to be a source of fierce debate once more.”
These articles are for information purposes only and are not a personal recommendation or advice.
Ways to help you invest your money
Put your money to work with our range of investment accounts. Choose from ISAs, pensions, and more.
Let us give you a hand choosing investments. From managed funds to favourite picks, we’re here to help.
Our investment experts share their knowledge on how to keep your money working hard.
Related content
- Tue, 17/12/2024 - 10:20
- Thu, 07/11/2024 - 11:00
- Wed, 06/11/2024 - 12:06
- Mon, 21/10/2024 - 16:26
- Wed, 09/10/2024 - 10:17